
“We scoffed when you predicted he would leave, six weeks later he was gone. Never in a million years would I have said he would leave”
Prediction is becoming a Commodity
I've been meaning to write this post for a couple of years now after first testing AWS machine learning tools for use with our customer's data sets. Prediction is becoming commoditized by highly available and inexpensive tools like AWS Machine Learning, Google's Cloud Machine Learning Engine, and Microsoft's Azure ML platform. It is now easy to take advantage of machine learning at a ridiculously low cost to the point that anyone can pick it up and start using the toolsets.
For HR this means any analyst can cobble together a data set, build a predictive model, and generate predictions without a data science team and no advanced knowledge required. Further below I give a rundown on how to create your own attrition risk model and predictions using Amazon's machine learning service but first, I'll discuss some of the observations we've had in using the service.
When everything works well
Right out of the gates I had a good experience with using these toolsets, I loaded a fairly simple data set of about 20 employee attributes (known as data features) and ran through the available UI wizard creating a predictive model. Even before generating a set of predictions the data source and model created provide some interesting information to look at, correlations, and a test set of predictions to see how well the model was expected to perform.
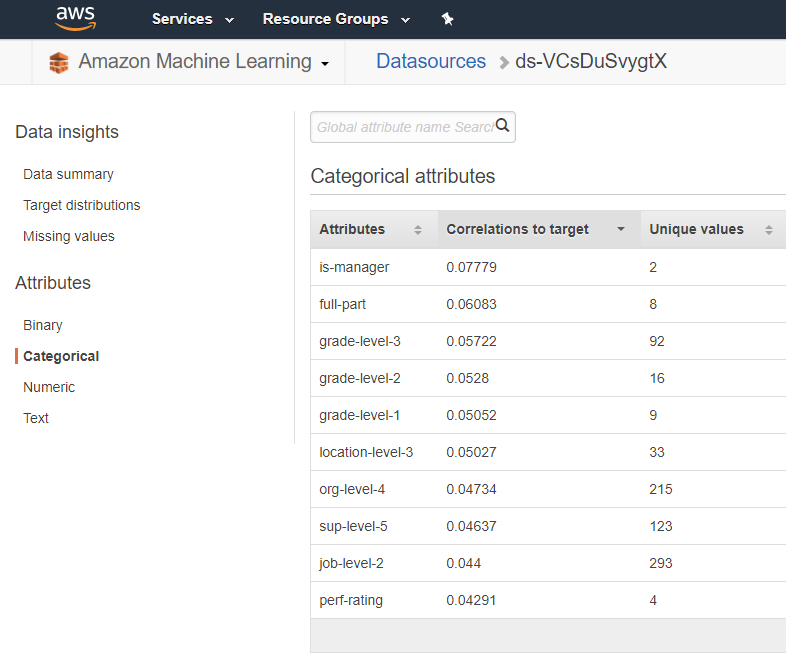
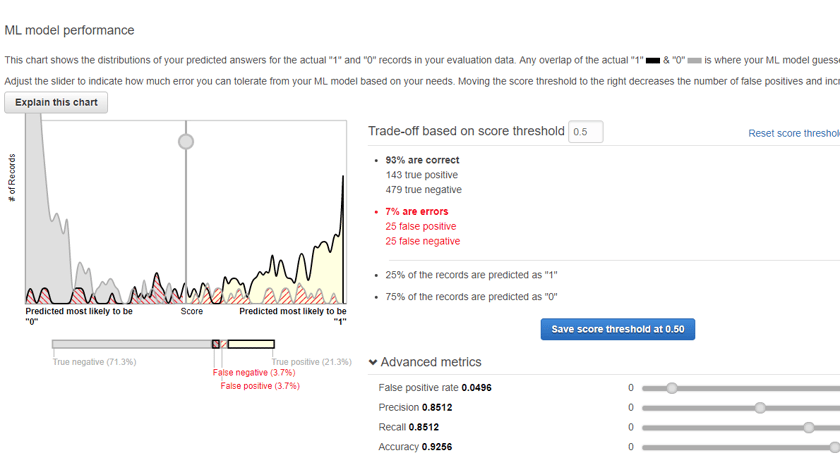
You can see in the images above an example of the data correlations to target (termination), and the performance of the model itself in a test evaluation. An encouraging first step, and so far I've spent about $0.05c in processing time. Loading a data file of employees that I wanted to run a prediction on and a couple minutes later we have a probability score and prediction for each person in the organization.
The performance wasn't quite as good as the evaluation test but it was still quite significant, I ran this test on a historical dataset (data as at one year ago) and could check the real-life performance of the model using actual terminations since that time. It wasn't bad, around 65% of people the model predicted as a 1 (terminated) ended up leaving the organization. This was on a data set that had a historical termination rate of ~20%. With some minor tweaking adding additional data features, removing some others that looked problematic and running the models and predictions monthly to incorporate new hires we pushed the performance up to an average of 75% over the following 12 months. That means 75% of the people the machine said would leave, did so in the next 12 months. Not bad at all.
For one of our customer tests, we found 65 high performing employees that were at risk of leaving. That's a turnover cost equivalent to at least $6,000,000 and this was on the first run only two weeks after they started our subscription with us. In fact, if they could save even one of those persons from leaving they would have well and truly paid for our subscription cost let alone the $15 it cost me to run the model. I mocked a dashboard on our demo site that was similar to that delivered to the customer below.


Since testing with other real world data sets I have the below observations about where the AWS tools work well.
- Works really well on higher turnover organizations, you simply have more patterns, and more data to work with, and a statistically greater chance of someone leaving. Turnover greater than 15% you could expect good performance.
- Simple feature sets work well with high turnover organizations i.e. employment attributes, performance, etc. I would however always add in more calculated features though to see if they correlate e.g. Time since last promotion/transfer/position change, Supervisor changes, Peer terminations etc. The less turnover you have the more important these additional data features are.
- A model generated across the whole company's data worked just as well as a model generated across a subset i.e. sales, engineering. Great, for the most part we could generate a single model and use against the whole organization.
- Ignore the categorical prediction 1 vs 0 and instead use the probability score to create your own predictions or buckets, i've found it easier to look at and bucket populations into risk categories using this method and obtain populations with probability values that we can focus on. This is particularly useful when we want to bucket say the top 600 or the top 12% of our population to match our historic turnover.
- I found the best test of performance before applying to current data was to run one model every month for a historical period say the last two to three years (24-36 monthly models), load the results into a database and be able to see how the models perform over time. It allows you to take a wider view of the models performance.
When everything falls apart
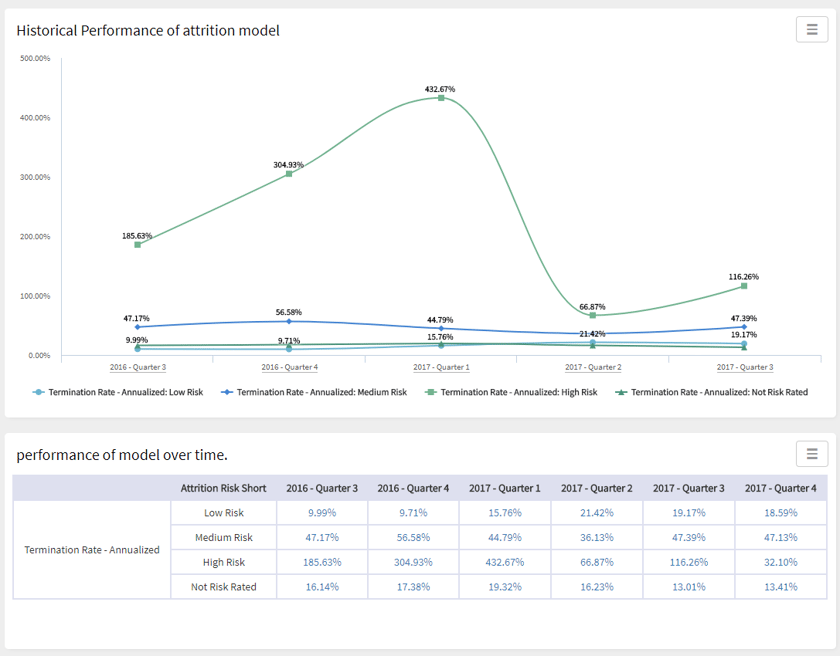
Well not quite but when it doesn't perform as well as you might expect, conversely to the above i've run tests on organizations where i haven't seen the same stellar outcomes. Or where the model works really well for a period of time but then dives off a cliff with no explanation as you can see in the below image. This is an example where we had a model that was perfoming really well until the turnover behaviour changed completely and was no longer predictable with the data we had feeding the model. This could happen with any model but we had particular issue trying to overcome with limited set of levers we could pull in AWS. You can see that the new behaviours were being identified but it took time to re-learn and regain it's performance. A note on the metrics use below; I like to use Termination Rate - Annualized as a measure of performance because typically we run and make these predictions monthly so the populations in each bucket are changing as new hires are made, terminations leave, and peoples attributes change which may make them change risk categories. This is the reason why you will see rates exceeding 100% as the denominator population is being refreshed with new people in the risk bucket
i.e. Termination Rate - Annualized: High Risk = Terminations: High Risk / Average Headcount: High Risk (annualized then of course)
Generally I've seen lower performance working with organizations who have low turnover (<8%) or are just relatively small. There just were not enough reliable patterns in the data to be able to obtain the same level of gains that we see in higher turnover, larger organizations. You can increase performance by adding more features that may show additional patterns but in the testing we did we could only get so far with the data available. However while we had lower performance we still saw turnover rates (terminations/average headcount) of high risk populations around the 40-60% mark which is still significantly better than the average turnover and provides a population to go and work with so the effort is not wasted.
To counter some of this you can use the probability scores to create risk buckets where you can then focus on precision of the prediction sacrificing recall (number of terminations captured). In this way you can be quite confident about a population even though it will be a smaller subset of the terminated population.
Ultimately we didn't use these tools in a production capacity because we needed to overcome a different set of challenges that individual organizations don't have to deal with i.e. how to deliver at scale for any customer, with any size (even small companies) and shape data set, to do so regularly, and always be at the highest level of accuracy. The automated tools available just couldn't meet our requirements and i'll discuss some of those reasons below, so we had to build our own Machine Learning for HR which we will release some content around soon.
In People Analytics the most common use case of prediction is still turnover as it represents a huge cost to the business and data is for the most part readily available. Next we will spin up a model in AWS and generate some predictions.
Stay Tuned for Part 2
If you would like to talk about our framework sooner please contact us or
%20(1).svg "One Model People Analytics for HR Logo")

%20(1).svg)
%20(1).svg)
%20(1).svg)
%20(1).svg)
%20(1).svg)