One Model is an amazing platform for orchestrating data from multiple systems, building an intelligent people analytics-ready data model, and surfacing insights to make better people decisions. Storyboards are the key vehicle for driving data-driven decision making. Working with customers, we noticed that in order to structure and guide the narrative of Storyboards, they would often add a lot of content onto one page. And even with section headings, some Storyboards could become exceedingly long. With a very long scrolling page, the user could sometimes lose track of where they were, and the inclusion of numerous charts and tables with large queries all on a single page could lead to extended loading times.
In response, we introduced Multi-Page Storyboards, a game-changer in narrative storytelling. These offer several key advantages, including the ability to delineate chapters of your narrative across distinct pages, each bearing custom-tailored titles.
When One Model released the first version of our Storyboards back in 2020, we were making a conscious pivot from the traditional dashboard concept into a world where communicating ideas, insights, and driving decision-making requires more than just assembling lots of data.
Yes, getting to grips with data orchestration is a great achievement, as is the creation of compelling data visualizations. However, arguably the biggest challenge is turning this sea of information into a compelling story that people can understand and use to guide action.
One Model Storyboards have long provided the ability to freely arrange content to tell a great story with data with cool features like including commentary on the page, flexibility to apply unlimited filters, role-based sharing, and many more.
Users can now effortlessly navigate between sections, swiftly accessing the information they seek. Each page loads content incrementally, sparing end-users from grappling with an overwhelming data dump with long wait times. Plus, Storyboard filters apply consistently across all pages, ensuring users maintain a coherent focus and context throughout their journey.
So, what does this product innovation look like in practice?
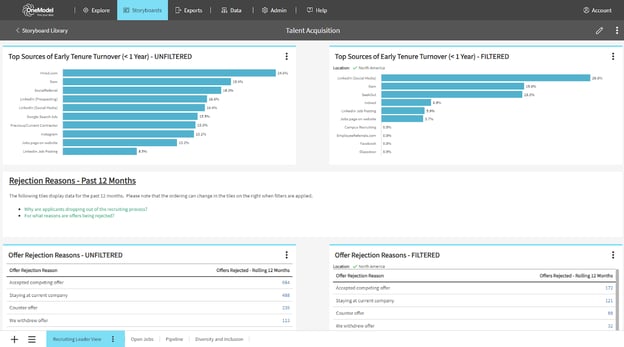
Let’s explore this Talent Acquisition scenario where the primary audience of this Storyboard is decision-makers involved in strategic recruitment for their organizations. Below is an example of a Talent Acquisition Storyboard. At the bottom of this Storyboard page, you will find a row of dashboard tabs with the titles of each subsequent page.

Page one of the tabbed dashboard is a ‘Recruiting Leader View’ with details about the Talent Acquisition Storyboard — including its intended purpose, the information it conveys, and practical guidance on how to effectively use it. This page serves as an invaluable resource for capturing key snapshot metrics, enabling you to swiftly communicate the status of key performance indicators (KPIs).
Having familiarized yourself with the overarching concept, you can delve deeper into specific, interconnected subjects on the subsequent pages.
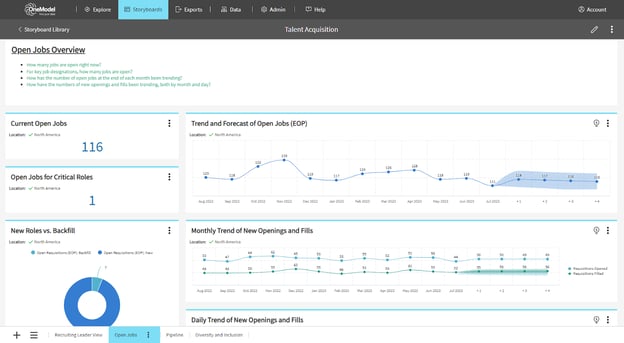
Page two delves into the realm of ‘Open Jobs’. Here you can identify key patterns and trends, view the status of jobs, and answer questions like how many roles are currently open in your organization. Use the page to track your open jobs by varying factors (such as location, department, and function) or through charts and tables tailored to your organization’s unique needs.

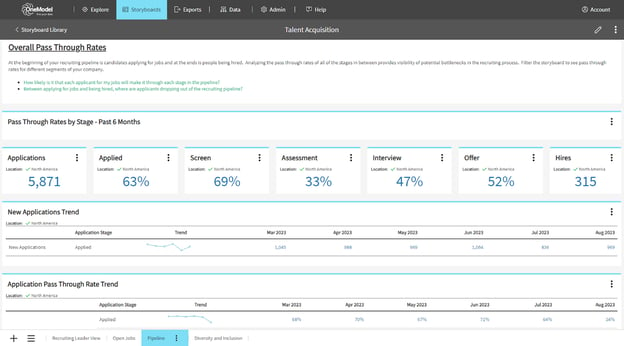
Next, turn your attention to page three: a dedicated space to track your ‘Applicant Pipeline’. Here you can effortlessly monitor the number of open jobs, the number of applicants, where applicants are in the application process, how many offers were made, and how many candidates were rejected. Quickly measure and chart your data in easy-to-read single value tiles that effectively communicate the state of your applicant pipeline. .

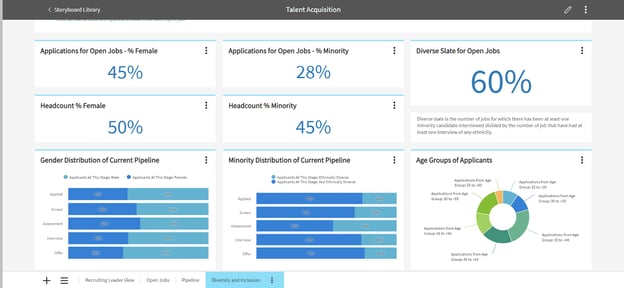
Moving on to page four, you can harness its capabilities to illuminate the progress of your diversity, equity, and inclusion (DEI) initiatives. This page serves as a powerful tool for gauging whether candidates from diverse backgrounds undergo a recruiting experience that mirrors that of others. Additionally, it allows you to meticulously scrutinize any biases that may emerge concerning candidates' genders, ethnicities, and ages.

This is just one straightforward example of how our multi-page dashboards can serve as an effective organizational framework for consolidating insights on a particular subject. The versatility of this tool extends to features such as page duplication within and across Storyboards, dynamic page reordering, and seamless page-to-page navigation — all designed to enhance your ability to tell incredible data stories.
Thank you to all our amazing One Model customers who are continually working with us to develop important new capabilities that cater to their specific needs and further empower data-driven decision making.
The best part is that One Model was built to connect all of your different data sources, from HR systems like Greenhouse, Workday, and SuccessFactors, into a single people analytics platform. This means that you won’t have to go searching through folders and directories to get the information you need when you need it most. Simply use One Model’s Multi-Page Storyboards to transform your data into attractive and meaningful data visualizations for more effective decision making.
Would you like to see Multi-Page Storyboards for yourself? Let's connect!

