

We received a lot of interest from Part 1 of this blog post so if you haven't read it yet head over for a summary view of our observations in Part 1.
In Part 2 I'm going to give you a brief walkthrough of setting up and running a turnover risk prediction in AWS' machine learning. At the end of this post, I have some further observations about improving tweaking and improving the performance of the base offering and additionally why we chose to move away from these toolsets and develop our own approach.
AWS Machine Learning https://aws.amazon.com/aml/
Step 1 - Sign up for an account
If you don't have an AWS account, you can sign up through the above link. Please check with your IT department for guidance on using AWS and what data you can upload to their cloud. You may need authorization or to anonymize your data prior to loading.
Cost
A quick exploration of expected cost so you know what to expect. Current pricing is below.
- $0.42c per hour for model processing
- $0.10c per thousand predictions
In my experience for a 5,000 employee company, this results in the below
- 10 minutes processing per model = $0.07c
- 5,000 predictions = $0.50c
$0.57c per model and set of predictions run.
I typically will create historical backtests generating a model each month for at least the last two years so I can gauge expected performance and track any wild divergence in model behavior. So let's call it $15 to run a full test (optional).
Step 2 - Prepare your Data
We'll need a flat .csv file that we can load, it's best to include a header row otherwise you will need to name your columns later in the interface which is just painful. The data you include will be all the data features we want to process and a field that shows our target that we are trying to predict, in this case, terminated that I have highlighted in yellow below. The data i use in my file is generally the active headcount of current employees and the last 1-2 years of terminations. The actives have a 0 for terminated and the terminated records have a 1. For a 5,000 person company with a 12% turnover rate that means I should have 5,000 active (0) records and around 1,200 terminated (1) records.

The data features used are important and as you create different models or try to improve performance you'll likely spend a good chunk of time adding, removing, or cleaning up the data in these features. A couple guiding points you'll want to do as you build your file
- You can't have null values, it will drop the record if there's an empty value in a column. Instead, replace any nulls either with a placeholder (the ? you can see above) or depending on the data field you may want to insert the median value for the column. The reason being is any placeholder will be treated as a distinct value and used in pattern detection, the median instead will treat the record as no different from other median records.
- If you can create a range, it's often useful to do so at this step especially if you are writing SQL to extract as it will then be repeatable on each data extraction (although there are options to do this in the aws UI later). I will often use both the actual value and the range itself as individual data features i.e. Tenure (years) we would have the number of years say 3 as a column and the range 3-<5 years as a column as well. One will be treated as a continuous numeric value while the other as a categorical grouping.
- I like to include hierarchical structures in the data features like department, or supervisor relationships, you don't need the whole tree, the top parts of the structure are often redundant but the middle to leaf levels are quite important.
- You can spend days building features and creating calculations, my general approach is to start with a basic set of features and expand as I can lay my hands on more data or have time to merge in a new data set. You can then at least test how a basic set of features performs which for some organizations can perform extremely well. Adding features can reduce performance and cause overfitting so having a baseline to compare with is always good.
Step 3 - Create a Datasource and ML Model
The wizards make the process of creating a datasource and a model ridiculously easy. Select "Datasource and ML model" from the "Create new" menu on the Machine Learning dashboard. You'll need to load your data file into S3 (AWS file storage system) and from there you can provide it's location to the wizard and give the source a name. You will likely have a number of datasources created over time so make the name descriptive so you can tell them apart.

You'll notice some information about providing a schema file. I do prefer to provide a schema file (see documentation here) as it means i can skip the next step of creating a schema for the file but if you have included a header row in your file you can tell the wizard to use the first row as the column names. You still, however, will need to provide a data type for column so the engine know how to treat the data. You have a choice of
- Binary - use this where there are only two possible states, our target status of terminated is either a 0 or 1 so it's a binary. Can also be used for other binary types e.g. true/false, yes/no, etc
- Categorical - perfect for any of the attribute or dimension style of fields i.e gender, age range, tenure range, department, country, etc. This is the most common selection I use.
- Numeric - any number will automatically be assigned this value but you will want to check it is applied properly to a numeric range i.e. age is correct as a numeric and will be treated as a discrete series but if you leave a department number as a numeric this is going to be worthless (change it to categorical)
- Text - you really shouldn't have a set of text values for this type of scenario so ignore for now and use categorical if in doubt.

If you hit continue from here you'll get an error that you haven't selected a target so go ahead and select the column that you used for your terminated status then hit continue. You'll need to do the same for your person identifier (usually an employee id) on the next screen. The next Review screen will give some info on the number of types etc but there's nothing else to do here but hit continue and move to our model selections.

Name your model (usually I'll match the datasource name with a -model or similar to the name). The same with the evaluation. Your biggest decision here is to use the default training and evaluation settings or to use the custom. With the custom you change the amount of training and evaluation data, the regularization type, the number of passes the engine should run over your data to detect patterns and the size of the model itself. For the most part, I've had the most success using the default settings, don't get into the custom settings until you are really trying to fine tune results as you can spend a lot of time here and have mixed results. So select default and move on.

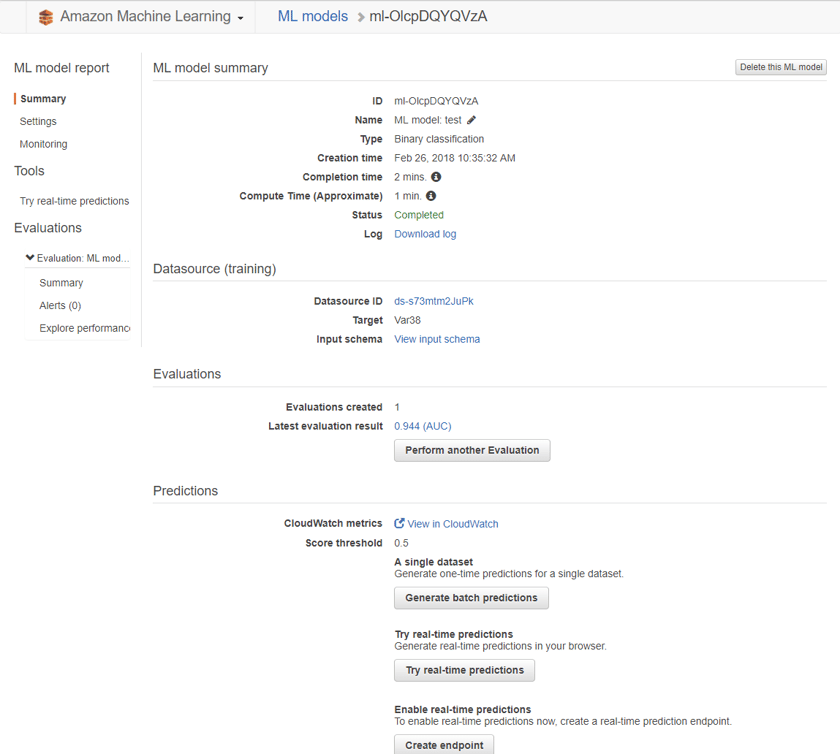
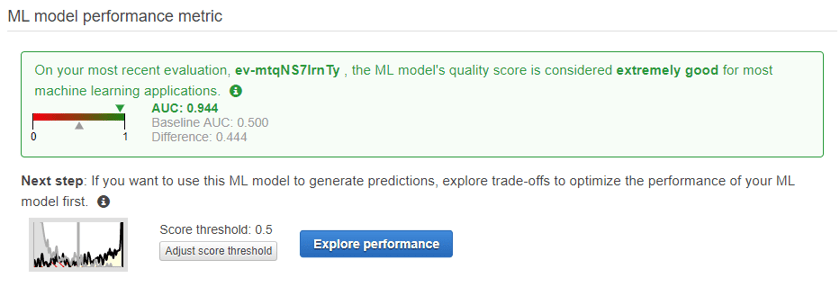
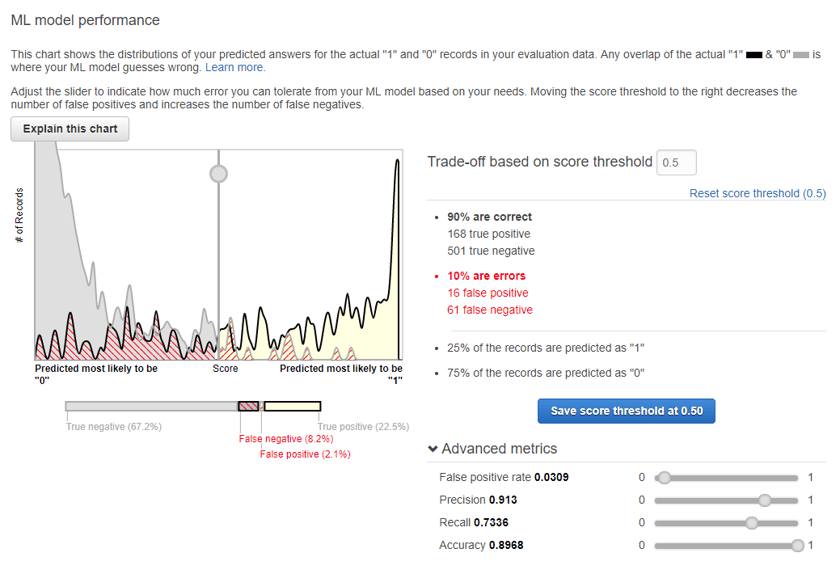
The above information set is pretty impressive, if we set our probability score threshold at 0.5 which is the point where a score above will be predicted as a termination and a score below will be predicted as active then we end up with 90% of our guesses being accurate. You can see the other metrics associated here for false prediction rates and you can play around with the sliders to adjust the trade-off score to different levels.
Now, this looks awesome but keep in mind this is an evaluation set of historical data and I had spent a fair amount of time selecting and constructing data features to get to this point. In real life the model didn't perform this well, success was more like 70-75% of guesses being correct which is still great but not as good as what you'll see in the evaluation. My guess here is I still have some overfitting occurring in the model.
If your evaluation performs poorly you'll want to go look at the info provided, you may have rows or columns being dropped from the data source (explore the data source id), your features may not be relevant, or some other problem has occurred. If your results are too good AUC = 1.0 then you likely have included a perfect predictor in the data features without realising i.e. an employment status or a placeholder department when somebody terminates or is about to terminate, check for something like this and remove.
Step 4 - Generate Predictions
When ready to generate some real-life predictions you can go ahead and click the "Generate Batch Predictions". You'll need to load a file to S3 for your predictions, this file will be the same as your input file but you will remove the terminated column (our target column) so it will only be slightly different. The contents will be for the people you wish to predict on, usually the current active headcount or if you are testing historically the active headcount at x point in time (if you do test historically your model obviously needs to be generated using data from x-1 day point in time).
Use the "My data source is in S3, and I need to create a datasource" go through the same prompts as you did for your training data source and once finished processing you'll have a predictions file to download.
This file gives you each person, their prediction value, and the probability score associated. You can load this into your own database or just view in excel however you may wish to consume.
Observations and Tweaking suggestions
Data Sources
- Start with a basic set of features and expand over time so you can evaluate how the new data is affecting your models. Some targets and models for organizations respond better to simple models and others need a lot more data features to find predictive patterns.
- Review the correlations of your attributes from the data source information after the source is created and processed. These will help you decide if a feature is useful and most importantly if you have a feature that is suspiciously predictive that you may wish to remove so that you don't pollute the model.
- If you are going to continue to experiment and iterate then definitely create .schema file it will save a bunch of time in avoiding setting UI options and make generating new source/models very fast.
- Try creating some features combining different fields you think may have some relation to each other e.g. Age-Tenure, 30-35_3-<5 yrs as an example of joining two ranges together. The ML will pick up some patterns like this but I've found creating some of these can help.
- The amount of data I describe early in the post is a little controversial i.e. using the current active headcount and historical terminations. Many data scientists will have issue here for one reason or another. For these people know that yes i have tested a number of different methods of balancing the data set, of oversampling data, and generally constructing to overcome different problems and through testing found in this example case of turnover the changes haven't reliably produced better real-life results. So my advice for people starting out is to just use a simple data set, and allow the toolset to do it's thing, then evaluation what you are seeing by applying your predictions back to your actual turnover.
- The amount of termination history can impact how a model performs, if behaviors change and you have a long history of terminations then the model may not adjust fast enough to cater for these new behaviors, it does help sometimes to shorten the amount of history you use if you have changing workforce behaviours. I was additionally creating new models every month for this reason as well.
Models
- Always use the default to start with while you figure out the datasource and features being used. No point playing around with advanced settings when you can extract the most gains from adding or altering data features early on.
- If you suspect overfitting and you've looked at all your features for anything suspicious then try a higher level of regularization in the advanced settings, you should still be able to leave the other settings at their default.
- I've not had
Evaluations
- Use them as an indicator that the model is doing its job and not perfectly fitting and not severely underfitting the data. In general aim for a AUC between 0.75 and 0.95 and you will generally do well.
- Adjust the score threshold to focus on precision if you want to reduce the number of people predicted as going to terminate (see next section).
Using Predictions
- Generally, I'll take my predictions output and ignore the binary terminated/active column and just use the probability score column. With this I can create my own risk categories where I can bucket people into Low, Medium, High Risk categories. The high risk people may be only the top 100 or so people that I have a high confidence are at risk. Particularly if you are going to focus on a group of people you probably want to focus on a smaller group to start with.
- If creating your own risk buckets i will plot out these scores and the actual results and decide which scores fit into each buckets. To do this you need to test historically to see how the model performs and to help guide your decision.
- Watch the model and it's results over time, don't do anything about the results just yet but try to understand how it is performing and if you can be confident in what it is predicting.
- MOST IMPORTANTLY - if you have enough confidence to start putting retention strategies in place with these people at risk, you must record this action. The action or lack of action needs to feed back into the model as it may affect behaviors and it's absence from the model will pollute its accuracy over time. I generally describe this as my back to the future theory of turnover risk, if you take an action and the model doesnt know about it you are effectively changing the past and destroying it's prediction of the future.
Why we didn't use these tools ourselves
The toolsets available from AWS, Google, Azure are fantastic easy entry points to start using your data in a predictive fashion. For One Model though they did not provide enough levers to pull when data or workforce behaviors don't fit into the out of the box view from these simplified toolsets. We needed a solution that would allow us to roll into any customer, evaluation all data for that customer, test through thousand of models, and build the most effective predictive model for any target. What's more, we wanted to open this capability to our customers whether they wanted to create their own models in a few clicks or if they had their own data science team and they wished to run their own predictive or statistical models in our infrastructure.
We couldn't achieve these objectives and we had to build our own approach that gave us this flexibility. One AI the new name for our augmentations is the result, and I obviously am biased but it is truly amazing. One AI is a collection of advanced calculations (feature engineering), data extensions (commute time, stock price, social data, etc), and the application of our automated machine learning frameworks.
It can concurrently test thousands of models and select the most accurate model for the target and the customer's data set. One problem it may choose a basic decision tree, for the next it will decide a neural network works best, and it's able to do this in minutes. The customer though still has the ability to adjust, customize, and put their own stamp on the models in use.
One of the biggest drawbacks of the black box methods though is that you have very little explanation as to why a prediction is made, this meant we couldn't provide our customers with the reasons why a person was at risk or what to do about it. In One AI we've built an explanation and prescriptive action facility to be able to show for each person the reasons why their prediction was made and what the biggest levers are to change this prediction.
We'll be officially announcing One AI shortly and making available collateral on our website in the meantime if you would like to talk about our framework sooner please contact us or