
The first in a series of posts tackling the individual nuances we see with HR technology systems and the steps we take in overcoming their native challenges to deliver a comprehensive people analytics for SuccessFactors program.
Download the White Paper on Delivering People Analytics from SAP SuccessFactorsQuick Links
- A long history with SuccessFactors
- Embedded Analytics won't cut it, you have to get the data out
- World leading API for extraction
- Time to extract data
- Full Initial Load
- Incremental Loads
- Modelling Data Both SuccessFactors and External
- SF Data Modelling
- Analytics Ready Fact Tables
- Synthetic Events
- Core SuccessFactors Modules
- MDF Objects
- Snowflake Schema Inheritance
- Metrics - Calculations - Analytics
- Delivered Reporting and Analytics Content
- Creating and Sharing your own Analytics Content
- Using your own Analytical Tools
- Feed Data to External Vendors
- What About People Analytics Embedded?
- What About SAP Analytics Cloud?
- What About SuccessFactors Workforce Analytics?
- The One Model Solution for SAP SuccessFactors
A long history with SuccessFactors
I'm starting with SuccessFactors because we have a lot of history with SuccessFactors. SF acquired Infohrm where many of our team worked back in 2010 and the subsequent acquisition by SAP in 2012. I personally built and led a team in the America's region delivering the workforce analytics and planning products to customers and ensuring their success. I left SAP in 2014 to found One Model. Many of One Model's team members were in my team or leading other global regions and, of course, we were lucky enough to bring on a complete world-leading product team from SAP after they made the product and engineering teams redundant in 2019 (perfect timing for us! Thanks SAP they're doing a phenomenal job!). So let's dive in and explore SuccessFactors data for people analytics and reporting.
Embedded Analytics won't cut it, you have to get the data out.
It's no secret that all vendors in the core HR technology space espouse a fully integrated suite of applications and that they all fall short to varying degrees. The SF product set has grown both organically and via acquisition, so you immediately have (even now) a disconnected architecture underneath that has been linked together where needed by software enhancements sitting above. Add in the MDF framework with an almost unlimited ability to customize and you quickly have a complexity monster that wasn't designed for delivering nuanced analytics.
We describe the embedded reporting and analytics solutions as 'convenience analytics' since they are good for basic numbers and operational list reporting but fall short in providing even basic analytics like trending over time. The new embedded people analytics from SF is an example where the data set and capability is very limited.
To deliver reporting and analytics that go beyond simple lists and metrics (and to do anything resembling data science), you will need to get that data out of SF and into another solution.
World leading API for data extraction
One Model has built integrations to all the major HRIS systems and without a doubt SuccessFactors has the best API architecture for getting data out to support an analytics program. Deep, granular data with effective dated history is key to maintaining an analytics data store. It still has its issues, of course, but it has been built with incremental updates in mind and importantly can cater for the MDF frameworks huge customizability. The MDF inclusion is massive. It means that you can use the API to extract all custom objects and that the API flexes dynamically to suit each customer. As part of our extraction, we simply interrogate the API for available objects and work through each one to extract the full data set. It's simply awesome. We recently plugged into a huge SuccessFactors customer of around 150,000 employees and pulled more than 4,000 tables out of the API into our warehouse. The initial full load took about a week, so it was obviously a huge data set, but incremental loads can then be used for ongoing updates. Some smaller organizations have run in a matter of minutes but clearly the API can support small through to enormous organizations, something other vendors (cough, cough ... Workday) should aspire to. To give you a comparison on level of effort we've spent on the One Model API connectors, approximately 600 hours has been spent on SuccessFactors versus more than 12,000 hours on our Workday connector. Keep in mind that we have more stringent criteria for our integrations than most organizations including fault tolerance, maintenance period traversal, increased data granularity, etc., that go beyond what most individual organizations would have the ability to build on their own. The point is, the hours we've invested show the huge contrast between the SF and Workday architectures as relates to data access.
Time to Extract data
Obviously, the time needed to extract the data depends on the size of the organization but I’ll give you some examples of both small and huge below.

Figure 1: Data extraction from SAP SuccessFactors using APIs
Full Initial Loads
In the first run we want everything that is available -- a complete historical dataset including the MDF framework. This is the most intense data pull and can vary from 20 minutes for a small organization of less than 1,000 employees to several days for a large organization above 100,000 employees. Luckily, this typically only needs to be done once during initial construction of the data warehouse, but there are times where you may need to run a replacement destructive load if there are major changes to the schema, the extraction, or for some reason your synchronization gets out of alignment. API’s can behave strangely sometimes with random errors, sometimes missing records either due to the API itself or the transmission just losing data, so keep this process handy and build to be repeatable in case you need to run again in the future. The One Model connectors provide an infrastructure to manage these issues.
If we're only looking for a subset of the data or want to restrict the fields, modules, or subject areas extracted, we can tell the connector which data elements to target.

Figure 2: Configuring the connector to SF in One Model platform
Incremental Updates
With the initial run complete we can switch the extraction to incremental updates and schedule them on a regular basis. One approach we like to take when pulling incrementals is to take not just the changes since the last run but also take a few extra time periods. For example, if you are running a daily update you might take the last two to three days worth of data in case there were any previous transmission issues, this redundancy helps to ensure accuracy. Typically we run our incremental updates on a daily basis, but you want to run more often than this you should first need to consider:
- How long your incremental update takes to run. SF is pretty quick, but large orgs will see longer times, sometimes stretching into multiple hours
- How long it takes your downstream processes to run an update any data
- If there’s a performance impact to updating data more regularly, typically if you have a level of caching in your analytics architecture this will be blown away with the update to start over again.
- Impact on users if data changes during the day. Yes, there can be resistance to data updating closer to real-time. Sometimes it's better to educate users that the data will be static and updated overnight.
- Whether or not the source objects support incremental updates. Not all can, and with SF there’s a number of tables we need to pull in a full load fashion, particularly in the recruiting modules.
Modelling data both SuccessFactors and External
Okay, we have our SF data and of course we have probably just as much data from other systems that we're going to need to integrate together. SF is not the easiest data set to model, as each module operates with its own nuances that, if you're not experienced with, will send you into a trial and error cycle. We can actually see a lot of the challenges the SF data can cause by looking at the failures the SF team themselves have experienced in providing cross-module reporting over the years. There have been issues with duplicates, incorrect sub domain schemas, and customer confusion as to where you should be sourcing data from. A good example is pulling from employee profile versus employee central. The SAP on premise data architecture is beautiful in comparison (yes really, and look out soon for a similar post detailing our approach to SAP on premise).
Modeling the SF Data
At this point we're modelling (transforming) the raw source data from SF into analytics-ready data models that we materialize into the warehouse as a set of fact and dimension tables. We like to keep a reasonable level of normalization between the tables to aid in the integration of new, future data sources and for easier maintenance of the data set. Typically, we normalize by subject area and usually around the same timescale. This can be difficult to build, so we've developed our own approaches to complete the time splicing and collapsing of records to condense the data set down to where changes occurred. The effort is worth it though, as the result is a full transactional history that allows the most flexibility when creating calculations and metrics, eliminating the need to go back and build a new version of a data set to support every new calculation (something I see regularly with enterprise BI teams). This is another example of where our team's decades of experience in modelling data for people analytics really comes to the fore.
During the modelling process there's often a number of intermediate/transient tables required to merge data sets and accommodate modules that have different time contexts to each other, but at the end of the day we end up materializing them all into a single analytics-ready schema (we call it our One schema) of tables. Some of what you would see is outlined below.
Analytics Ready Fact Tables
One.Employee - all employee effective dated attributes
One.Employee_Event - all employee events, equivalent to action/reason events (e.g. Hire, Termination, Transfer, Supervisor change, etc.). Usually you'll need to synthetically create some events where they don't exist as action/reason combinations. For example, many customers have promotions that aren't captured in the system as a transaction but are logically generated where a pay grade occurs alongside a transfer or any similar combination of logic.
One.Requisitions - all Requisition's and events
One.Applications - all application events
One.Performance_Reviews - all performance review events
... the list goes on
Dimension Tables
One.dim_age - age breakout dimension with levelling
One.dim_gender - gender breakout dimension typically a single level
One.organizational_unit - The multi-level organization structure
… we could go on forever, here's a sample below of fields

Figure 3: Examples of tables and fields created in the One Model data schema
Synthetic Events
A core HRIS rarely captures all events that need to be reported on, either because the system wasn't configured to capture it or the event classification is a mix of logic that doesn't fit into the system itself. These are perfect examples of why you need to get data out of the system to be able to handle unsupported or custom calculations and metrics. A frequently recurring example is promotions, where an action/reason code wasn't used or doesn't fit and for reporting a logic test needs to be used (e.g. a change in pay grade + a numeric increase in salary). We would implement this test in the data model itself to create a synthetic event in our Employee_Events model. It would then be seen as a distinct event just like the system-sourced events. In this fashion you can overcome some of the native limitations of the source system and tailor your reporting and analytics to how the business actually functions.
Core SuccessFactors Modules
Employee Central - Aligns with our Employee, Employee Event tables and typically includes about 100+ dimensions as they're built out. The dimension contents usually come from the foundation objects, picklist reference tables, an MDF object, or just the contents of the field if usable. This is the core of the analytics build and virtually all other modules and data sets will tie back to the core for reference.
Recruiting - Aligns with our Applications, Application_Event, and Candidates fact tables covering the primary reporting metrics and then their associated dimensional tables.
Succession - Aligns with Successor and associated dimensions
Performance - Performance Reviews (all form types) and associated dimensions
Learning - Learning Events, Courses, Participants
Goals - Goals, Goal_Events
MDF objects
MDF objects are generally built into the HRIS to handle additional custom data points that support various HR processes. Typically we’ll see them incorporated into one of the main fact tables aligning with the date context of the subject fact table (e.g. employee attributes in One.Employee). Where the data isn’t relevant to an existing subject, or just doesn’t align with the time context, it may be better to put the data into its own fact table.
Usually the attribute or ID would be held in the fact table and we would create a dimension table to display the breakout of the data in the MDF object. For example, you might have an MDF object for capturing whether an employee works from home. Captured would be the person ID, date, and the value associated (e.g. ‘Works from Home’ or ‘Works from Office’).
The attribute would be integrated into our Employee fact table with the effective date and typically a dimension table would also be created to show the values allowing the aggregate population to be broken out by these values in reporting and analysis.
With the potential for a company to have thousands of MDF objects, this can massively increase the size, complexity, and maintenance of the build. Best to be careful here as the time context of different custom objects needs to be handled appropriately or you risk impacting other metrics as you calculate across domains.
Inheritance of a snowflake schema
Not to be confused with Snowflake the database, a snowflake schema creates table linkages between tables that may take several steps to join to an outer fact or dimension table. An example is that of how we link a dimension like Application Source (i.e., where a person was hired from) to a core employee metric like Headcount or Termination Rate which has been sourced from our core Employee and Employee Event Tables. An example of this is below, where to break out Termination Rate by Application Source and Age we would need to connect the tables below as shown:

Figure 4: Example of connecting terminations to application source
This style of data architecture allows for a massive scale of data to be interconnected in a fashion that enables easier maintenance and the ability to change pieces of the data model without impacting the rest of the data set. This is somewhat opposite of what is typically created for consumption with solutions like Tableau which operate easiest with de-normalized tables (i.e., giant tables mashed together) which come at the cost of maintenance and flexibility. Where one of our customers wants to use Tableau or similar solution we typically add a few de-normalized tables built from our snowflake architecture that gives them the best of both worlds.
Our calculation engine is built specifically to be able to handle these multi-step or matrix relationships so you don’t have to worry about how the connections are made once it’s part of the One Model data model.
Metrics - Calculations - Analytics
When we get to this point, the hardest work is actually done. If you've made it this far, it is now relatively straight forward to build the metrics you need for reporting and analytics. Our data models are built to do this easily and on the fly so there isn't a need for building pre-calculated tables like you might have to do in Tableau or other BI tools. The dynamic, on the fly nature of the One Model calculation engine means we can create new metrics or edit existing ones and be immediately using them without having to generate or process any new calculation tables.
Creating / Editing Metrics
Figure 5: Example of creating and editing metrics in One Model
Delivered Reporting and Analytics Content
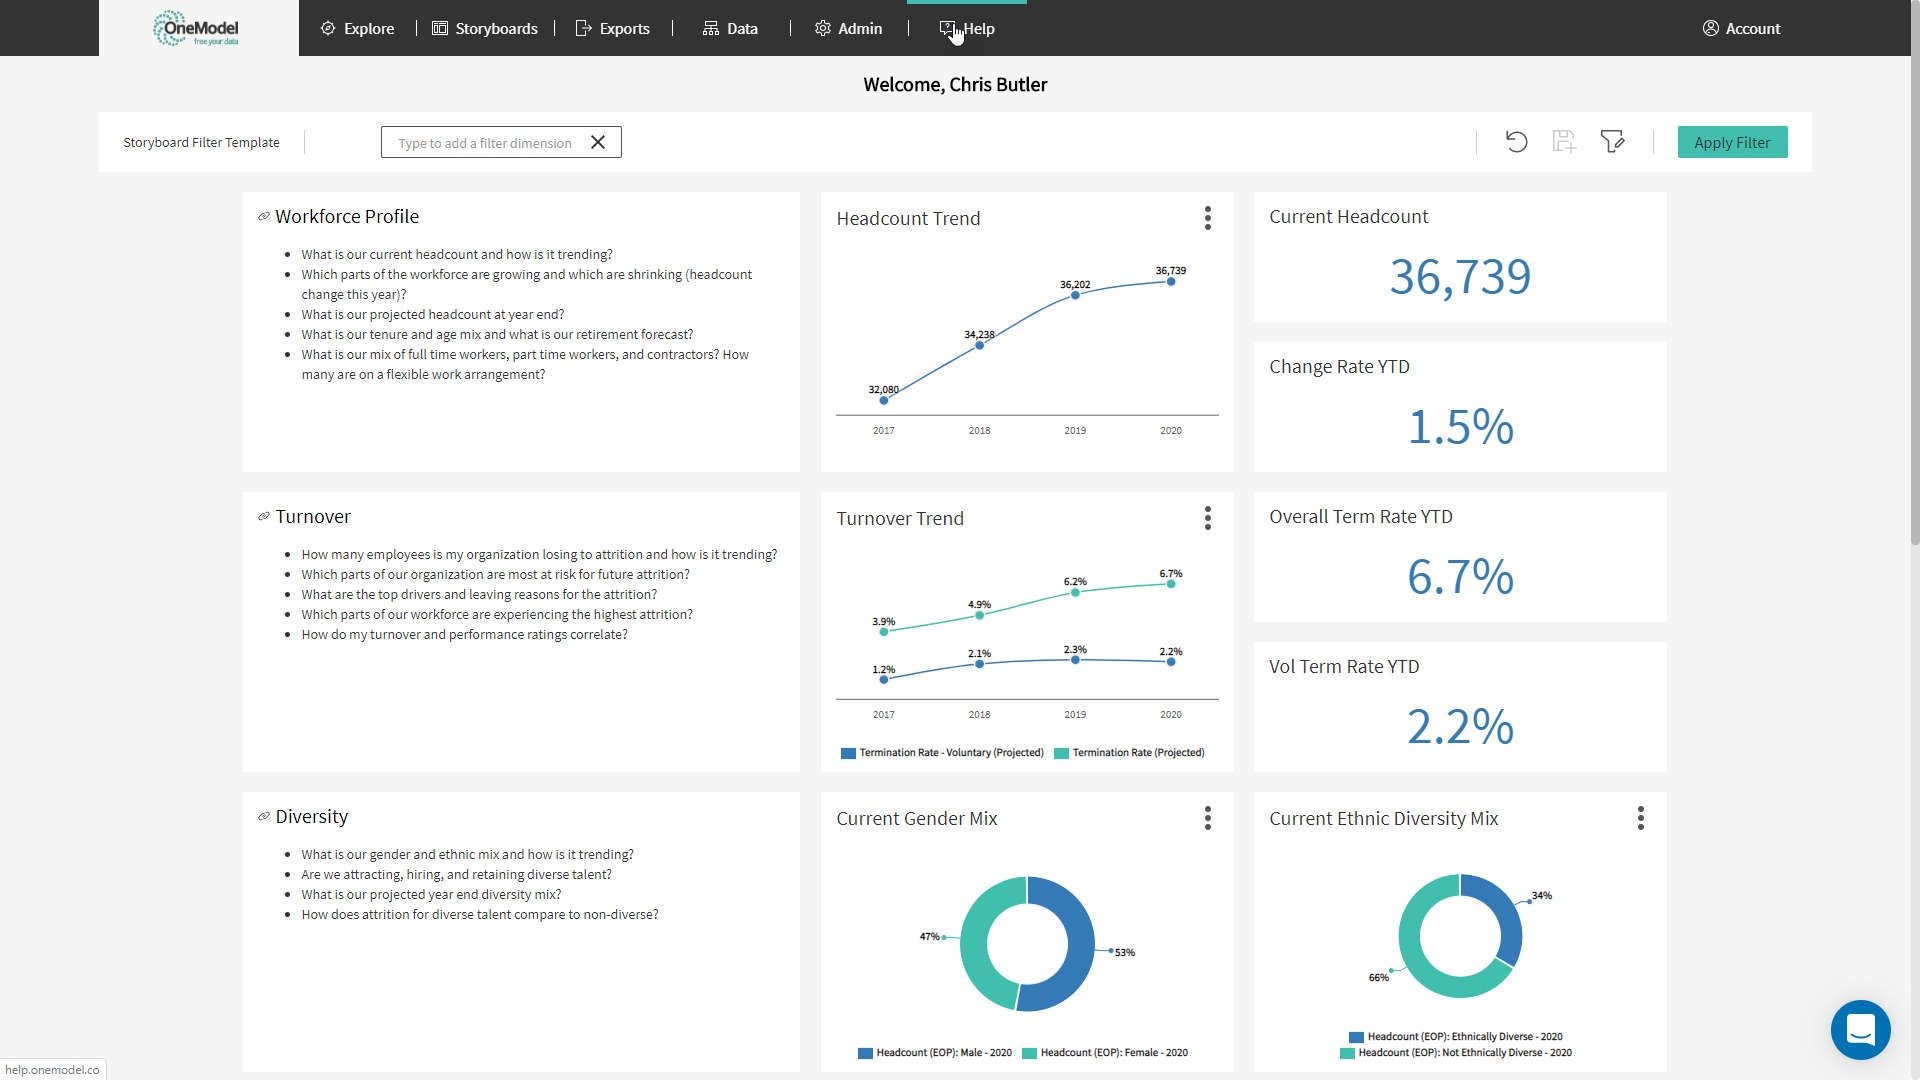
With an interconnected data model and a catalogue of pre-defined metrics, it is straight forward to create, share and consume analytics content. We provide our customers with a broad range of pre-configured Storyboard content on top of their SuccessFactors data. A Storyboard library page allows a quick view of all subject areas and allow click through to the deeper subject specific Storyboards beneath. This content is comprehensive covering off the common subject areas for analytics and reporting such as workforce profile, talent acquisition, turnover, diversity, etc. There is also the ability to create dashboards for monitoring data quality, performing data validations, and viewing usage statistics to help manage the analytics platform.
Figure 6: Sample of standard Storyboard content in One Model
Creating and Sharing your own Analytics Content
Every one of our customers adds to the pre-configured content that we provide them, creating their own metrics and storyboards to tell their organization's people story, to support their HR, business leaders, and managers, and to save their people analytics team time by reducing ad-hoc requests for basic data. Our customers make the solution their own which is the whole point of providing a flexible solution not tied to the limitations of the underlying source system.
Content in One Model is typically shared with users by publishing a storyboard and selecting which roles will have access and whether they can edit or just view the storyboard itself.
There's a number of other options for distributing data and content including:
- Embedding One Model Storyboards within the SuccessFactors application itself
- Embedding One Model Storyboards within Sharepoint, Confluence, or any other website/intranet (e.g. the way we have used frames within this site: https://covidjobimpacts.greenwich.hr/#)
- Pushing data out to other data warehouses (what we call a "data destination") on a scheduled basis, something that works well for feeding other tools like Tableau, PowerBI, SAP Analytics Cloud, and data lakes.
Sharing Storyboards
Embedding Storyboards

Example of embedded storyboard
COVID Job Impacts site - https://covidjobimpacts.greenwich.hr/#

Using your own Analytical Tools
We want to ensure you never hit a ceiling on what you can achieve or limit the value you can extract from your data. If you wish to use your own tools to analyse or report on your data, we believe you should have the power to do so. We provide two distinct methods for doing this:
- Direct Connection to the One Model Data Warehouse. We can authorize specific power users to access the data warehouse directly and read/write all the raw and modeled tables in the warehouse. If you want to use Tableau or PowerBI in this way, you are free to do so. You can write your own queries with SQL or extract directly from the warehouse in your data science programs such as Python or R. The choice is yours. At this point, it is essentially your warehouse as if you created it yourself, we have just helped to orchestrate the data.
- Data Destinations. If you need to feed data to an enterprise data warehouse, data lake, or other data store, then our data destinations functionality can send the selected data out on a scheduled basis. This is often used to integrate HR data into an enterprise data strategy or to power an investment in Tableau Server or other where teams want the HR data in these systems but don't want to build and run the complex set of APIs and data orchestration steps described above.
In both of these scenarios, you're consuming data from the data model we've painstakingly built, reaping the productivity benefits by saving your technical team from having to do the data modelling. This also addresses a perennial issue for HR where the IT data engineering teams are often too busy to devote time to understanding the HR systems sufficiently to deliver what is needed for analytics and reporting success.
Feed data to external vendors
Another use for the data destinations described above is to provide data to external vendors, or internal business teams with the data they need to deliver their services. Many of our customers now push data out to these vendors rather than have IT or consultants build custom integrations for the purpose. We, of course, will have the complete data view, so you can provide more data than you did in the past when just sourcing from the HRIS system alone. A good example of this is providing employee listening/survey tools with a comprehensive data feed allowing greater analysis of your survey results. Another use case we've also facilitated is supporting the migration between systems using our integrations and data models as the intermediate step to stage data for the new system while also supporting continuity of historical and new data. (Reference this other blog on the topic: https://www.onemodel.co/blog/using-people-analytics-to-support-system-migration-and-innovation-adoption)
Scheduled Data Destinations

Figure 10: Example of data destinations in One Model
What About People Analytics Embedded?
This solution from SF is great for what we call 'convenience analytics' where you can access simple numbers, low complexity analytics and operational list reports. These would provide basic data aggregation and simple rates at a point in time without any historical trending. In reality, this solution is transactional reporting with a fancier user interface. Critically, the solution falls down in its inability to provide the below items:
- Trending across time (an analytics must have)
- Limited data coverage from SF modules (no access to data from some core areas including learning and payroll)
- Challenges joining data together and complexity for users in building queries
- No ability to introduce and integrate external data sources
- No ability to create anything of true strategic value to your organization.
What About SAP Analytics Cloud?
SAC has shown some great promise in being able to directly access the data held in SF and start to link to some external source systems to create the data integrations you need for a solid people analytics practice. The reality, however, is the capability of the product is still severely limited and doesn't provide enough capacity to restructure the data and create the right level of linkages and transformations required to be considered analytics-ready. As it is today, the SAC application is little more than a basic visualization tool and I can't fathom why an organization would take this path rather than something like Tableau or PowerBI which are far more capable visualization products.
SAP Analytics Cloud has not yet become the replacement for the Workforce Analytics (WFA) product as it was once positioned. The hardest parts of delivering a robust people analytics software has always been the ongoing maintenance and development of your organizational data. The SF WFA's service model provided this with an expert team on call (if you have the budget) to work with you. With SAC, they have not even come close to the existing WFA offering, let alone something better. The content packages haven't arrived with any depth and trying to build a comprehensive people analytics suite yourself in SAC is going to be a struggle, perhaps even more than building it on your own in a more generic platform.
What About SuccessFactors Workforce Analytics?
Obviously, our team spent a lot of time with SuccessFactors' WFA product even predating the SF acquisition. The WFA product was a market and intellectual pioneer in the people analytics field back in the day and many members of our team were there, helping hundreds of organizations on their earliest forays into people analytics. The WFA solution has aged and SF has made little to no product improvements over the last five years. It is, however, still the recommended solution for SF customers that want trending and other analytics features that are relatively basic at this point.
Several years ago, we started One Model because the SF WFA product wasn't able to keep pace with how organizations were maturing in their people analytics needs and the tool was severely limiting their ability to work the way they needed to. It was a black box where a services team (my team) had to deliver any changes and present that data through the limited lens the product could provide, all for a fee of course. Organizations quickly outgrew and matured beyond these limitations to the point I felt compelled to tackle the problem in a different fashion.
One Model has become the solution we always wanted to help our customers become successful and to grow and mature their people analytics capability with data from SAP SuccessFactors and other systems. We provide the integrations, the analytical content, the data science, the transparency, scalability, and configurability that our customers always wished we could provide with SF WFA. We built our business model to have no additional services cost, we keep all aspects of our data model open to the customer, and our speed and delivery experience means there's no limit to which modules or data sets you wish to integrate.
The One Model Solution for SAP SuccessFactors
| Direct API Integration to SuccessFactors | Unlimited data sources |
| Daily data refresh frequency | Unlimited users |
| Purpose built data models for SAP and SF | No additional services costs |
| People analytics metrics catalogue | Create your own metrics and analytics |
| Curated storyboard library for SuccessFactors | Operational reporting |
| Embed and share storyboards | HR's most advanced predictive modelling suite |
| Access all areas with a transparent architecture | Use your own tools e.g. Tableau, PowerBI, SAC |

Take a tour in the video below
We are happy to discuss your SuccessFactors needs.