
Talent flow, whether it occurs through promotions, internal transfers, exits, or new hires, is a key facet of workforce management. Understanding these employee journeys within a company and across careers gives senior leaders insight into how these movements affect the organisation's health and growth.
A survey conducted by Deloitte identifies that focusing on internal mobility improves leadership development, business expansion, and employee engagement. It also offers HR professionals deep insights into:
- Recruitment and Onboarding
- Career Progression
- Retention and Turnover
- Succession Planning
- Diversity, Equity and Inclusion
- Strategic Workforce Planning
Wowledge states that “the positive effects of a well-structured internal mobility program ripple through various facets of organisational excellence….promoting a culture of collaboration, diverse thinking, and cross-functional experiences.”
Improving ROI with Employee Retention
In a world experiencing major shifts in how work gets done and the very nature of jobs utilising AI in the workplace, being able to reskill and redeploy people is more cost effective than ever. The cost of replacing your workforce is many factors higher than the cost to reskill and harness the creative capability of people you already have within your company. Gallup puts that cost at $1 trillion annually for US businesses.
This financial impact means that the relationship between internal movement and length of tenure becomes critical, as SHRM reports:
- 24% average turnover rate in first year
- 5 years with no movement = 62% turnover rate
- Promotion within first 3 years = 70% more likely to stay
- Lateral move within first 3 years = 62% more likely to stay
The Challenges of Talent Flow Analysis
Despite its value, analysing internal workforce mobility is a major headache for HR teams. The One Model platform helps customers get a handle on this topic by solving these key challenges:
1. Stitching together movements across time and transforming employee events into a timeline.
2. Handling data quality issues with advanced business logic.
Inconsistencies in HRIS movement codes can arise due to varying applications across business units, job roles, or changes from acquisitions. One Model addresses this with the ability to generate automatic mobility events as needed, such as a specific promotion and pay increase.
3. Pro-rating employee headcount and FTE daily.
Unlike traditional and less sophisticated reporting that captures only end-of-month employee snapshots, One Model reports at the daily level to effectively measure time spent in each position/business unit, and identify movements in real time.
4. Aligning movements across all other analytical dimensions available in the platform, including diversity, jobs, salary grades, locations, org units, age, tenure, and more.
The Foundation of Effective Talent Flow Analytics
Getting your data in shape is the very foundation of good talent flow analytics. This gives you the ability to create impactful metrics like the following small sample:
- Promotions
- Transfers
- Hire Rate - External and Internal
- Hire Rate (Net)
- Career Path Ratio
- Lateral Mobility Rate
- Promotion Velocity
- Retention Rate
- Termination Rate
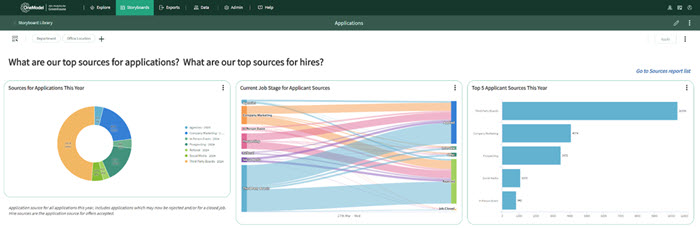
Introducing One Model Sankey Diagrams
Sankey Diagrams are a cutting-edge feature that revolutionise the way HR teams visualise and understand corporate people movement, or movement of discernable groups of people (cohorts) within their organisations. These diagrams are renowned for their ability to depict various pathways through a sequence of steps. For example, financial analysts use Sankey diagrams to understand investments and money movements, while Google Analytics uses them to visualise the journey of web traffic.
A Sankey chart is ideal when you need to see and simplify a many-to-many connection between two or more entities. It allows HR and senior leaders to see the flow of cohorts through different departments, positions, ranks, levels of performance, and more – at a glance.
3 Benefits of Sankey Charts
Workforce mobility reporting in data tables provides insights into the dynamics of your workforce. But Sankey Diagrams excel at enabling the average person to quickly see and understand lots of data and the degree of movement at a glance.
A few of the benefits HR leaders gain by using Sankey Diagrams to map out the paths that clusters of employees take as they move within the company include the ability to:
1. Identify Bridges and Bottlenecks
A Sankey people flowchart identifies both positive and problematic trends so you can leverage what’s working well and correct what isn’t. For example, are there certain departments acting as springboards into leadership roles? Or perhaps some areas are experiencing higher turnover, signalling potential issues with job satisfaction or career development opportunities. With this tool, these questions no longer remain a mystery.
2. Reinforce Strategic Planning
Talent flow analysis with Sankey diagrams aids in strategic planning and decision-making. It allows HR teams to pinpoint where to invest in training and development, how to better support career progression, and ways to enhance retention strategies. Organisations are better equipped to tailor their HR initiatives to not only address current gaps but also anticipate future needs.
3. Support Diversity, Equity, and Inclusion Efforts
Sankey diagrams enable people analytics professionals to highlight talent diversity - or lack thereof - throughout the organisation. This visibility enables HR to develop targeted programs that support the advancement and retention of underrepresented groups, fostering a more inclusive workplace culture.
Tell Dynamic Data Stories with One Model Sankey Diagrams
We’re always looking for ways to help clients unlock a deeper understanding of workforce dynamics to help optimise their talent management strategies.
The unique and compelling data stories you’ll be able to tell can be created directly within One Model Storyboards. Creating a chart involves just 3 simple steps, illustrated by a quick on-page guide.
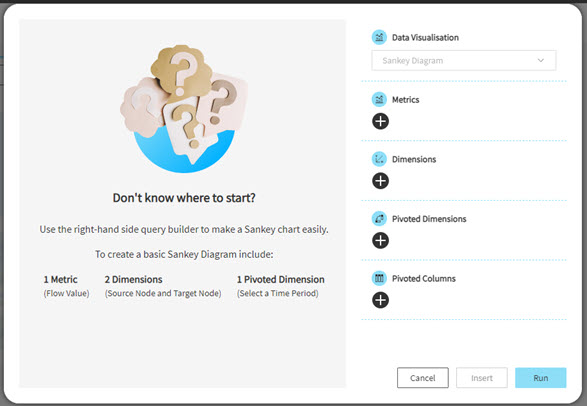
The Sankey diagram is the latest chart we’ve added to help you tell stories with your data using what we call archetypal visualisations. Data visualisations are purposefully designed to tell particular stories. Compared to generic visualisations (e.g., bar charts, line charts, tables etc.) – which are useful – archetypal visualisations are simply more compelling and fit for purpose in particular cases.
The Org Chart is another example of archetypal visualisation (and more!) that are coming soon to the One Model platform. Ultimately, we believe Sankey diagrams will help you better understand the flow of talent within your company and create a more engaged, satisfied, and dynamic workforce.
We'd love to show Sankey Diagrams in-person.