


 Overview
.svg) One AI
One AI
 Data Mesh
.svg) One AI Assistant
One AI Assistant
 Data Stories
 Enterprise AI
 One AI Data Intelligence


 Overview
 Employee Engagement
.svg) Talent Retention
Talent Retention
-1.svg) HR Dashboards
HR Dashboards
 Succession Planning
.svg) Talent Acquisition
Talent Acquisition
 Workforce Analytics
 Why One Model
-2.svg) Whitepapers
Whitepapers
 Blog
Blog
-2.svg) Events & Webinars
Events & Webinars
.svg) Product Innovation Blog
Product Innovation Blog
-1.svg) Roles in People Analytics
Roles in People Analytics
.svg)
 Contact Us
-3.svg) Partners
Partners
 About Us
-3.svg) Careers
Careers
-1.svg) News
News
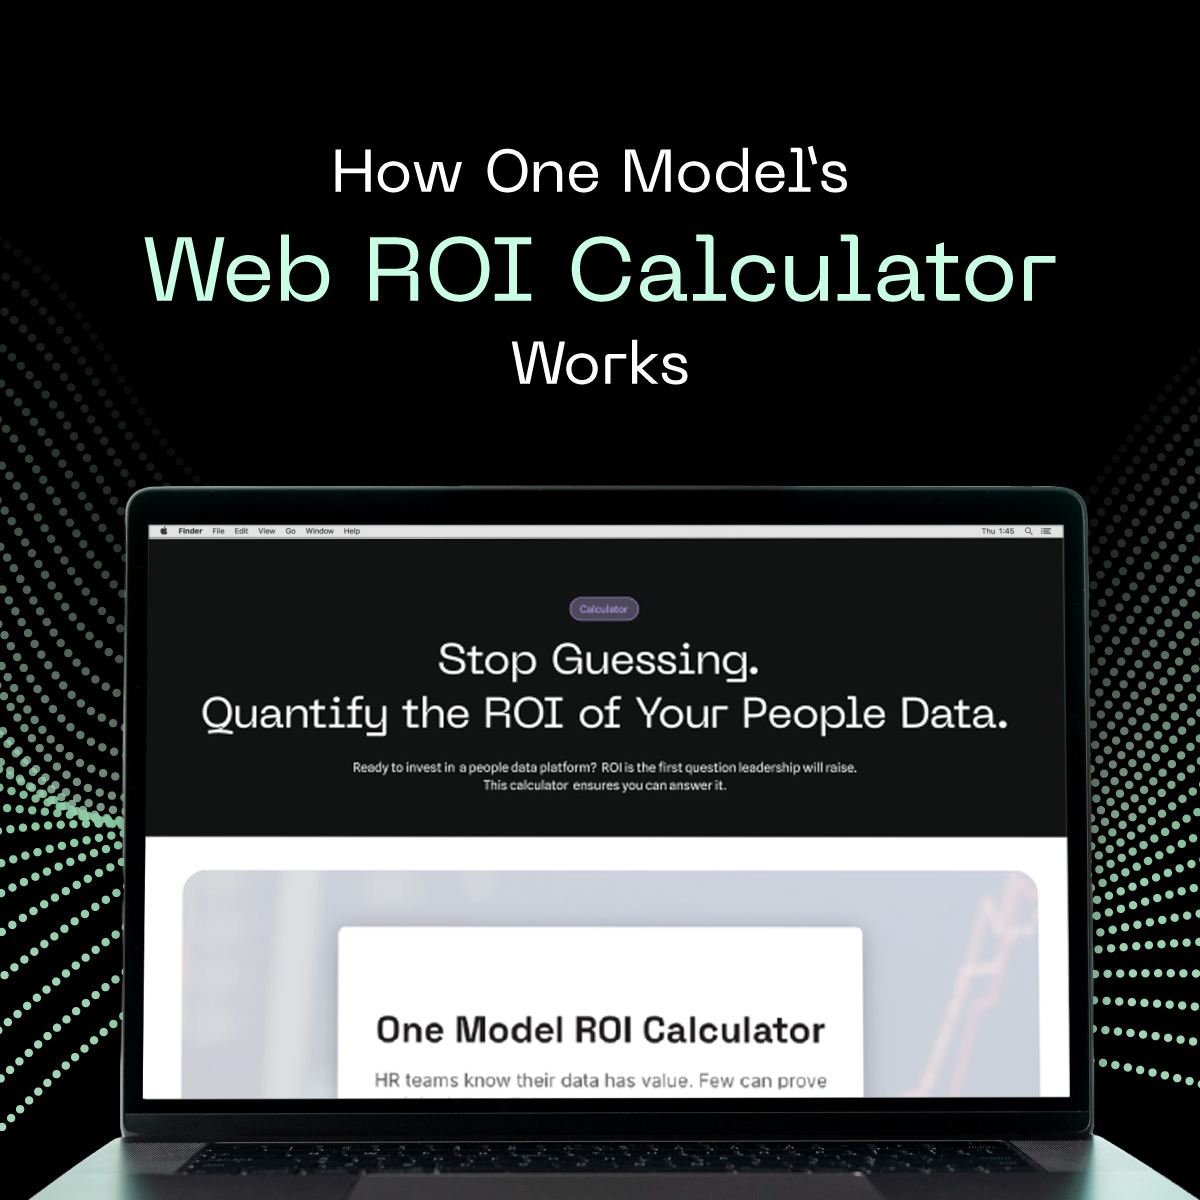

If you have ever run a vendor ROI calculator and thought, "there is no way these numbers are real," you are right to be skeptical. Most HR tech ROI tools are marketing instruments designed to produce impressive outputs, not defensible ones. They layer optimistic assumptions and ignore implementation ramp-up.
We built ours differently. This post explains exactly how the One Model ROI calculator works, where every benchmark comes from, and why the output is designed to survive scrutiny.
What the Calculator Actually Measures
The One Model Web ROI calculator takes seven inputs about your organization and produces a single output: the total risk-adjusted value that One Model is projected to deliver over three years across three value pillars:
-
Talent Acquisition — the recovered productivity from filling roles faster. Every day a role sits open, your organization produces less than it should. We quantify that gap using your revenue per employee per workday, multiplied by the number of hires you make each year.
-
Operational Efficiency — the time recovered from two groups that silently bleed capacity in most organizations: people analytics analysts who spend the majority of their week wrangling data rather than generating insight, and the managers and HRBPs who wait days for answers they should be able to pull themselves in minutes.
-
Retention Value — the financial impact of moving the needle on avoidable turnover by just one percentage point. Not solving turnover wholesale. One employee saved per hundred.
The calculator assumes each of these pillars will improve over time by a specific degree. The improvements we apply are drawn from carefully researched benchmarks. The pillars are calculated from your inputs, summed, and then discounted through a conservative multiplier before the output is displayed. More on that multiplier shortly.
Where Every Number Comes From
We did not invent the benchmarks embedded in the calculator. We sourced them from published research, and in every case we chose the most conservative figure available.
5 days faster time-to-fill. The SHRM Talent Acquisition Benchmarking Report documents improvements of 5 to 20+ days when organizations deploy people analytics tooling. We use 5 days, which is the floor of that range, to ensure the output holds up under challenge.
8 hours per week of analyst time recovered. Gartner's Data and Analytics Survey (2021) found that analysts report spending 60 to 80 percent of their time on data wrangling and preparation rather than analysis. We model 8 hours recovered in a 40-hour week (20%) at a loaded hourly rate of $60, which is below the median fully-loaded compensation for a senior people analytics analyst at a US enterprise organization (Bureau of Labor Statistics).
10 minutes per day of manager wait time. Forrester's Total Economic Impact studies across HR technology implementations document self-reported data wait times ranging from 10 to 45 minutes per day for managers and HRBPs. We use the floor.
50 percent salary replacement cost. SHRM and Gallup research places the full cost of replacing a departing employee at 50 to 200 percent of annual salary, depending on role seniority and industry. We deliberately use 50 percent, which is the lowest figure in the published range.
1 percentage point improvement in voluntary attrition. Internal One Model customer data and Deloitte People Analytics research document analytics-driven retention programs achieving 2 to 5 percentage point improvements within 18 months. We model 1. Not because we expect customers to see only a 1-point improvement, but because the calculator is conservative.
We would rather understate and be right than oversell and lose your trust.
Every loaded hourly rate used in the calculator is below the median for the relevant role. Every time-saving assumption is at the conservative end of the published range. The pattern is intentional.
The 1.8x Multiplier: Not a Buffer, Not a Guess
The most common question we get about the calculator is about the multiplier applied to the total benefit sum before the output is displayed. It is 1.8x, and it is worth explaining precisely.
The calculator does not assume Day 1 full utilization. It does not assume that every analyst immediately recovers 8 hours per week, or that retention improvements appear in the first quarter. Enterprise software implementations have a real adoption curve, and pretending otherwise would make our output indefensible.
The calculator applies a year-by-year value realization ramp to each pillar, and it is important to be precise about what that means. This is not a measure of how many people in your organization are using the software. It is a measure of how much of the potential value within each pillar is being realized, given the reality of how enterprise implementations unfold: 60 percent utilization in Year 1, reflecting implementation, onboarding, and change management; 85 percent in Year 2, as rollout broadens and self-serve adoption builds; and 100 percent in Year 3, when the organization is extracting full benefit. The cumulative factor across three years is 245 percent — or 2.45 times Year 1 value. That compares to 3.0 times if you naively tripled Year 1, which would ignore the ramp entirely.
On top of the value realization ramp, the calculator applies a confidence adjustment to each of the three pillars, reflecting how observable and near-term each type of value is. Talent acquisition and operational efficiency savings are relatively direct and measurable — time-to-fill data exists, analyst hours are trackable. Retention improvements take longer to materialize and are harder to attribute cleanly, so they receive a more conservative adjustment. The blended average across the three pillars is approximately 73 percent.
Multiply the adoption ramp (2.45x) by the blended risk adjustment (0.73) and you get 1.79x, which we round to 1.8x and apply as a single blended multiplier in the web calculator.
This is not a conservative estimate applied to make the number feel safer. It is the mathematical output of modeling real adoption curves across the value pillars and real implementation risk. The skepticism is built in before you run the first number.
What the Output Does Not Tell You
We believe transparency requires being explicit about what the calculator does not show.
The output is a gross value figure. It represents the total value One Model is projected to deliver to your organization. It does not include the One Model subscription cost. That figure depends on your organization's size, configuration, and contract terms, and we discuss it in the context of a formal business case rather than a directional estimate.
The output is also not a guarantee. It is a conservative directional estimate based on inputs you provide and benchmarks from published research. The accuracy of the output depends on the accuracy of your inputs. If your revenue, headcount, or turnover figures are estimates, treat the output as directional accordingly.
And the output is not a replacement for a formal business case. For organizations heading into a procurement decision, we build a more detailed model with your verified inputs, separate line items for each benefit category, NPV and payback period outputs, and a full benchmark citation document. That is the number your CFO will scrutinize, and it is built to survive that scrutiny.
Why Transparency Is the Point
We published this methodology for a straightforward reason: the people analytics professionals who use One Model are, by definition, analytically sophisticated. They will pressure-test any number we put in front of them. And they should.
If you have run the calculator and have questions about the methodology, the benchmarks, or the assumptions behind your specific output, we are happy to walk through it in detail.
Talk to an Expert
