


 Overview
 One AI
 Data Mesh
 One AI Assistant
 Data Stories
 Enterprise AI
 One AI Data Intelligence


 Overview

 Employee Engagement
 Talent Retention
 HR Dashboards
 Succession Planning
 Talent Acquisition
 Workforce Analytics
 Case Studies
 Whitepapers
 Blog
 Events & Webinars
 Product Innovation Blog
 Roles in People Analytics
 Contact Us
 Partners
 About Us
 Careers
 News
 Why One Model

By September 2026, our AI usage numbers had gone flat, and for a while I read that as good news. About a hundred of our people were using AI in any given month. In July nearly every one of them (93 of 94) had already handed AI a whole goal rather than a question at least once. Typed requests per person barely moved: about 58 tasks a month in July, 57 in October. By the measures most organisations report, AI adoption was done.
Underneath that flat line, the way our work got done changed a lot. I only saw it because we stopped counting prompts and started measuring the work.
This is the first of a series of posts on what we found. If you’re responsible for how AI is changing your workforce, whether you sit in HR, IT or operations, then this is for you.
What we measured instead of AI usage data
A prompt is a poor unit of work. One task can take forty prompts. One long prompt can contain three unrelated jobs. So our One Model AI Impact product groups requests into tasks (one person, one session, broken wherever they step away for more than an hour) and reads each task for the activities in it, such as reviewing a pull request, building a slide deck or looking up a customer's deal history. Each activity is placed on a tree of about 600 activities built from the work our people actually did, and linked to the skills it draws on in the ESCO and O*NET frameworks.
Every task also records who ran it. A person can direct the AI step by step, or state the goal and stay in the conversation. Above that, an agent can run the task with ten or more tool calls in a turn or with sub-agents, and a scheduled job can run with nobody at the keyboard. The first two are run by a person. The second two are run by AI.
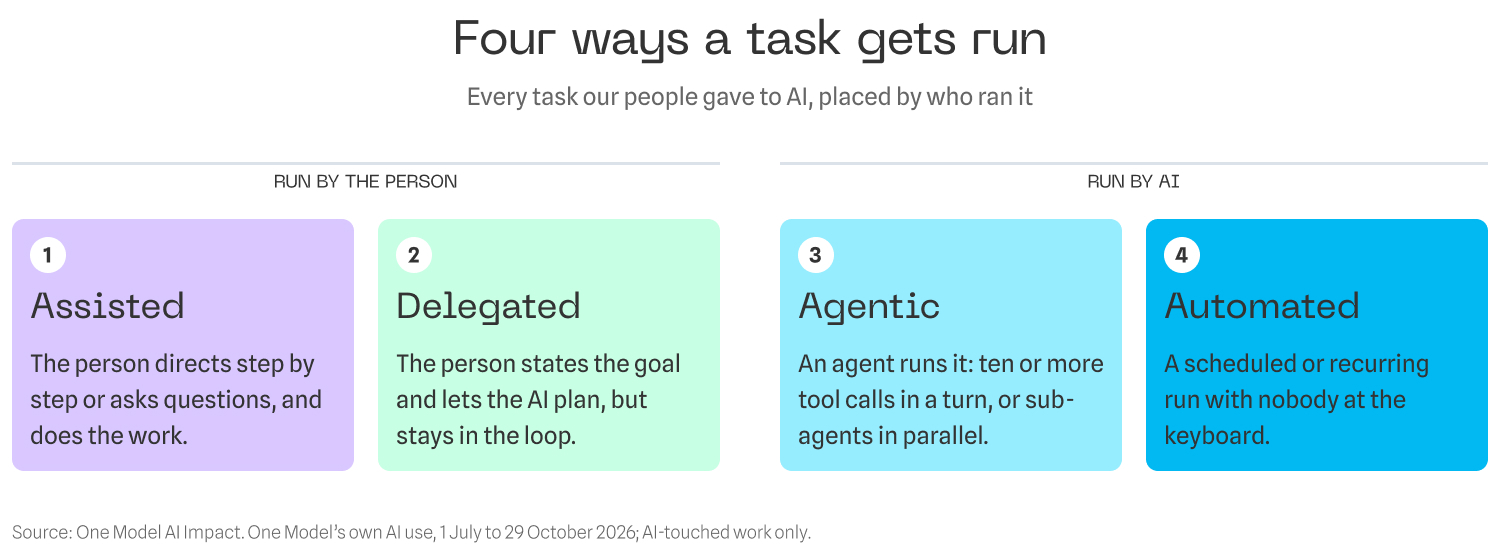
Figure 1.1: Four ways a task gets run. The bottom two steps are run by the person, the top two by AI.
From 1 July to 29 October that gave us 27,288 tasks from 114 people.
What changed while usage stayed flat
In July, agents or scheduled jobs ran about half of our AI-touched work (52%). By October it was two thirds (67%).
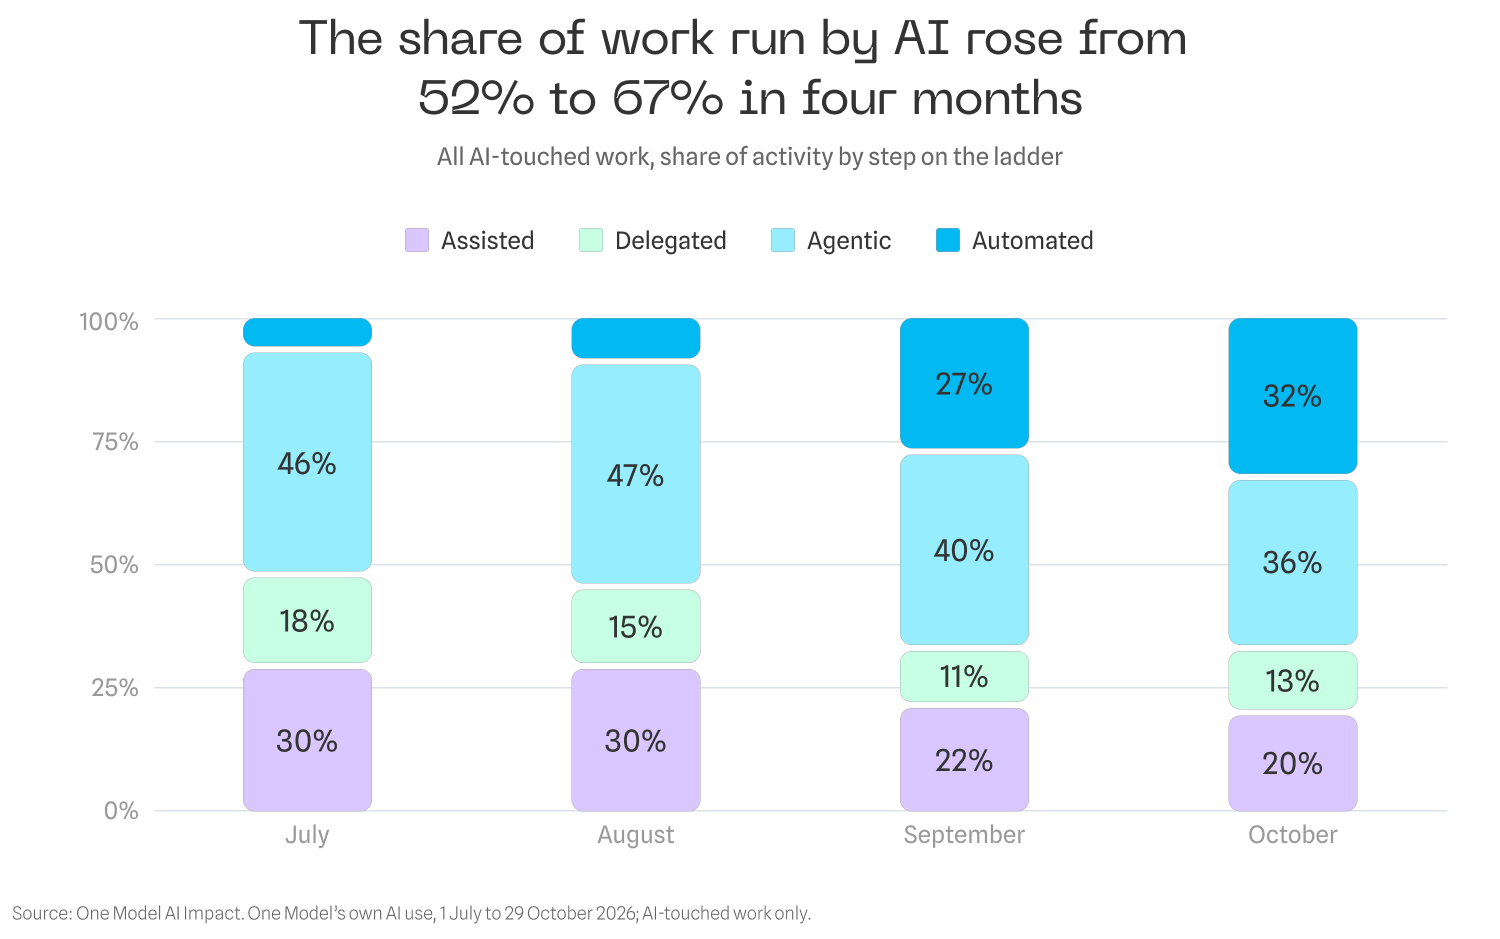
Figure 1.2: The share of AI-touched work run by agents or automation rose from 52% in July to 67% in October.
Most of that came from scheduled work, which went from 369 runs a month to 2,750. If you take scheduled work out and look only at tasks where someone was at the keyboard, the move is smaller, from 49% to 52%. I find that smaller number the more interesting one, because almost all of it happened inside tools people already had. The next post in this blog series is about that.
The bigger story is in the detail. We compared each activity in July and August with September and October. Of the 187 activities with enough volume to compare, 50 moved at least ten points towards being run by AI. Slide decks, SQL queries, tickets and CRM look-ups moved most. Twenty-four moved at least ten points the other way, back to people, and most of those were diagnostic work: finding out why a build failed or why a screen behaves oddly. The skills our people exercise through AI moved too. The number of skills where AI now does most of the operating went from 32 to 55, out of 258 we could compare.
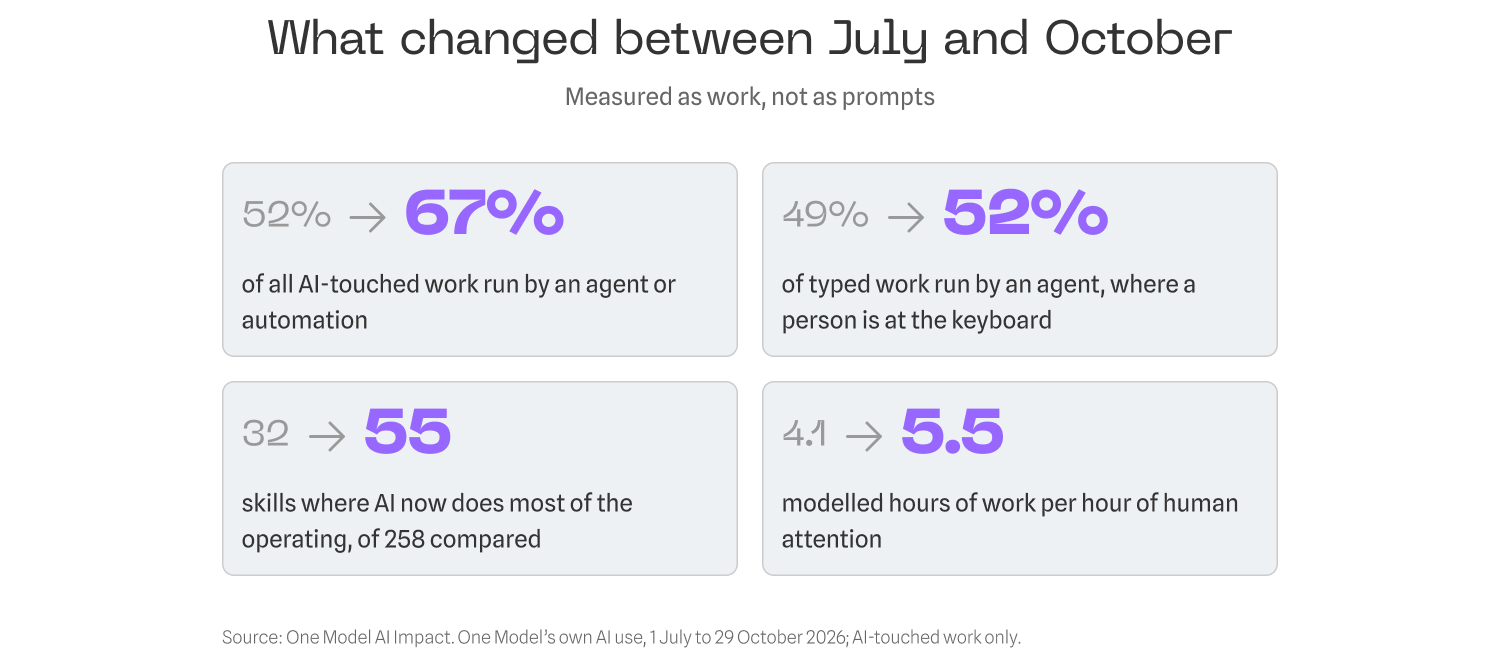
Figure 1.3: What changed between July and October, measured as work rather than prompts.
What I think this means
AI adoption reporting has a short shelf life. It answers whether people are using AI, which matters for the first six months. After that it tells you very little, and if it is still the main thing your leadership sees, they will conclude the job is done just as the real change starts.
We spoke to one People Analytics leader who told us their company had unusually low turnover overall. However, there were pockets of very high turnover that nobody knew about, because prior to using One Model, the data to see them wasn’t readily available. The issue only surfaced when on-site managers started escalating and asking for help. Just compiling the data to investigate took three weeks.
Looking back, that leader estimated that with One Model's trend and forecast views in place, the problem would have shown up in the data six months before the managers raised it. Applying a cost-of-turnover model to that six-month head start gave her team a concrete estimate of the turnover they could have avoided. Turnover cost doesn’t show up as a line item on the balance sheet, but it’s a real cost, and this is how you make leadership see it.
The limits
This is one company of about 110 people, weighted towards software engineering, over four months. It covers work that went through AI. We have no record of the work people did without it, so I can't tell you what share of all our work AI now does. The activity and skill readings are model judgements, checked against samples. Read the direction of the numbers more than their precision.
If your usage chart has gone flat
What I've described is what One Model's AI Impact product does: it reads the work going through your AI tools as tasks, activities and skills, and shows how that is changing by team and by month. If your adoption numbers have stopped telling you anything new, I'd be glad to show you what sits underneath them.
Request a Personal Demo Today.
