

Brilliant talent decisions require superb data. But how do you know what decision power lies in your data? Test it for yourself! Our People Analytics Challenge can give you a sense for the state of your human resources data and your organization's ability to make great decisions.
To find out just how prepared your organization is to make brilliant talent decisions with the data you have, download our handy worksheet here.
People Data Cloud™, One Model’s leading people analytics platform, can transform how you make talent decisions by making the human resources and related enterprise data that you already have access. Unlocked and properly harnessed people analytics can be an incredibly valuable asset to your company.
Understanding the People Analytics Challenge
Where did we get the questions? Our very own Phil Schrader (One Model's Solution Architect), along with his peers across our business, spent decades in the human resources function applying data analysis to common HR decisions and solving talent challenges. Phil compiled the most common questions into this worksheet. He then used our proprietary People Data Cloud technology to produce the tables, charts, graphs, and reports to demonstrate how a true people analytics capability can help HR practitioners.
For sh*ts and giggles, we also timed how long it took Phil to arrive at these answers.
Here are some of those questions.
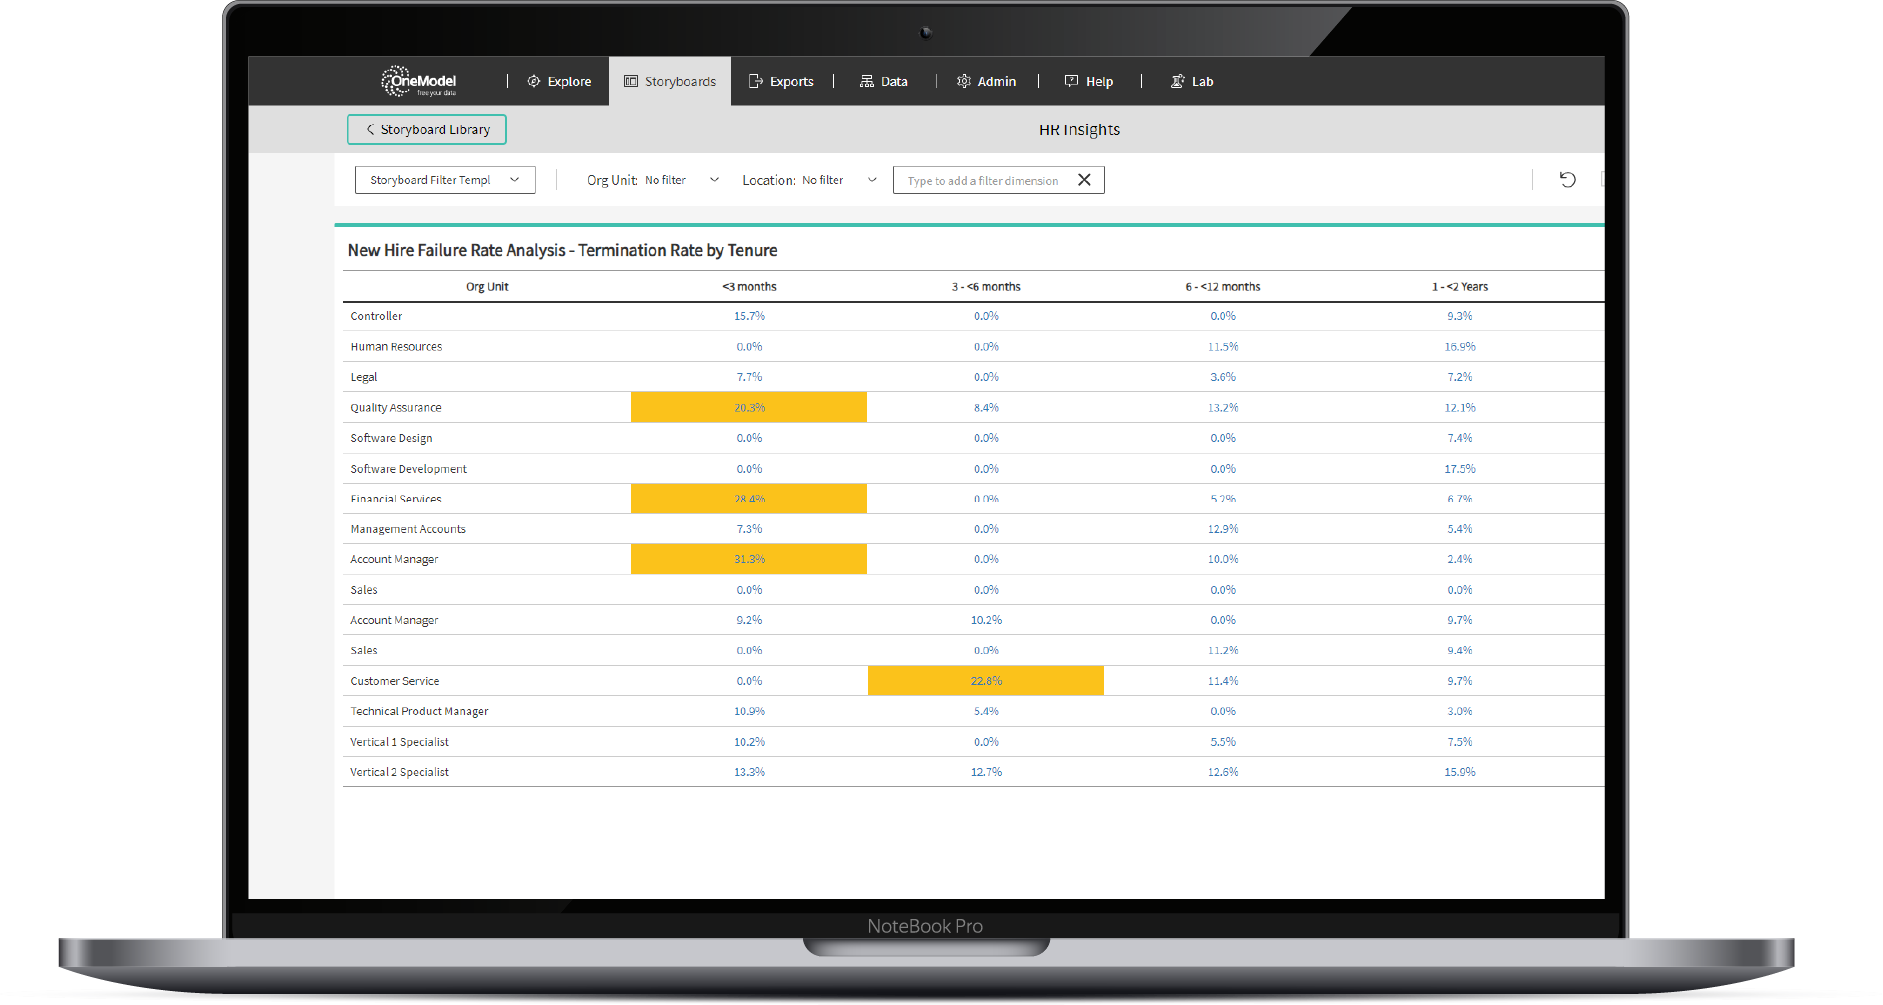
Question #74: What is our new hire failure rate, by tenure and by department?
Phil's time on this KPI: 4 minutes 45 seconds
%2074%20New%20Hire%20Failure%20Rate%20Analysis.png?width=642&height=324&name=(4min%2045sec)%2074%20New%20Hire%20Failure%20Rate%20Analysis.png)
Finding out where your new hires fail, and at what point in their tenure, gives you a clear place to focus attention. Addressing new hire failures with this data reduces the average cost to hire and gives the organisation continuity and increased productivity.
Here's the most important people metrics of all time.
Question #1: What is our revenue by employee
Phil's time on this KPI: 5 minutes 24 seconds

Building a straightforward report like this doesn't take much time, but One Model also has a lot of pre-built views that interpret your data after ingestion and create the data visualization for you. Let's see how quickly Phil can get information like this.
|
Are you ready to take the People’s Analytics Challenge? Download our whitepaper and put your team to the test. Follow the hashtag #peopleanalyticschallenge on LinkedIn and let us know if you can beat Phil! |

|
Question #38: What is ratio of managerial to non-managerial employees, and how does this vary by department?
Phil's time on this KPI: 2 minutes 43 seconds

It actually took Phil longer to take the screenshot I needed for this blog post than it did for him to pull the answer to this question.
Now, let's pick a question that may require a little debate on how the metrics are built. This question will require Phil to meet with key players in the company to ensure the customizable calculations are exactly what we need to get the best insight.
Question #25: What is the depth of our leadership pipeline within the company?
Phil's time on this KPI: 44 minutes 56 seconds

Benchmarks and succession planning in people analytics are not always measured the same from company to company. To make our timing as realistic as possible, we put together a quick meeting with our VP of Strategy and mapped out the best methodology for the three charts. If you'd like to better understand Succession Planning and see how the build was done, watch the video on this post. After we aligned on the variables that we needed to include and how to piece them together, connecting the dots did not take much time, about 15 minutes.
Do you have a team of data scientists at your fingertips? All People Analytics Enterprise Solutions customers get a custom Blueprint and ongoing support to get the most out of their data.
As the final part of this challenge, I want you to ask your team this question, “Can we trust the data?” If your team is working tirelessly in spreadsheets or SQL, they can probably tell you exactly how those metrics were calculated. However, if you were using some other HR analytics reporting tools, you’re trusting a black box. Moving to One Model not only means you can get to the analysis you need in record time, but you also have a fully transparent platform that is adjustable to meet the specific requirements of your organization.
Are you Stumped? Get a Demo:
Regardless of where your organization is on the maturity scale, this “challenge” can help you determine the selection of the right people analytics key performance indicators and analyses for your business context. Arguably any strong people analytics function should be able to answer these KPI questions, but success is found in focusing on the questions that matter and will drive business outcomes.
Take the #PeoplesAnalyticsChallenge and let us know how fast you can pull that information in your organization.
